EDR (Endpoint Detection & Response)
One-line summary: Antivirus checks who someone is (signatures). EDR watches what they do (behavior), records everything as telemetry, connects the dots into detections, and lets you respond from one console, wherever the endpoint is.
0. Why EDR Exists
- Organizations used to protect the network perimeter (firewalls, proxies).
- Remote work moved laptops outside the perimeter. A laptop at home or in a café gets no protection from the office firewall.
- EDR protects the endpoint itself: monitored constantly, threats detected, no matter where it is.
Popular EDRs: CrowdStrike Falcon (used in the course screenshots) · Symantec EDR · SentinelOne · Microsoft Defender for Endpoint
The Three Pillars: "See it, Spot it, Stop it" 👁️🔍🔧
| Pillar | Slogan | What it does |
|---|---|---|
| Visibility 👁️ | See it | Collects detailed endpoint data and shows it structured (process tree, timeline, history) |
| Detection 🔍 | Spot it | Signature + behavior + ML + anomaly + custom IOCs; catches fileless malware in memory |
| Response 🔧 | Stop it | Isolate host, kill process, quarantine file, remote shell, all from the console |
The order matters: you can't spot what you can't see, and you can't stop what you didn't spot.
1. Visibility
EDR records: process modifications · registry modifications · file & folder modifications · user actions · and much more.
What the analyst gets:
- Process tree / graph: each node = a process; lines = parent → child relationships. Click + on a node to see its network connections, registry changes, file changes.
- Events timeline: the full sequence of actions.
- Historical data for threat hunting.
- Every detection arrives with full context, not as a lonely log line.
🧩 Reading the course's process tree (worth practicing)
tor.exe ──► rar.exe  ...*.pdf *.doc *.docx        ← archiving documents = data staging for exfiltration
tor.exe ─┬► soy.exe (in \Temp\) ──► cmd.exe ──► sc.exe  ...\Temp\VBoxDrv.sys
         │                                         ← creating a service for a driver from Temp
         └► net.exe user ... /add /active:yes ──► net1.exe
                                                   ← creating a new active user account = persistence
[Likely] How an analyst reads this:
- tor.exe as a parent: anonymised traffic, almost never legitimate on a corporate endpoint.
- rar.exe packing
.pdf/.doc/.docx→ collecting data to steal. - soy.exe running from Temp → dropped malware.
- sc.exe loading VBoxDrv.sys from Temp → installing a driver as a service, a classic way to get kernel access (and often to disable security tools).
- net user /add /active:yes → a backdoor account.
- Each step alone might look like admin work. The tree tells the story.
2. Detection
The detection dashboard
Each row = one detection, with severity, detect time, process on host, user, triggering file, hostname, command line, and Tactic via Technique (= MITRE ATT&CK mapping). Click a row for rich details.
Examples from the course dashboard:
| Detection | Why it's suspicious |
|---|---|
powershell.exe on SRV-01 by Administrator → Defense Evasion (High) | Admin PowerShell on a server trying to hide |
Setup.exe from Downloads\Photoshop 26.3 (Cracked) by j.adams → Machine Learning (High) | Pirated software = classic malware delivery |
cmd.exe /c TIMEOUT 5 & del "C:... by k.smith → Adware (Low) | Wait, then delete itself = self-cleaning malware trick |
The 5 detection techniques:
| Technique | How it works | Course example |
|---|---|---|
| Behavioral | Watches what a file does, not what it is | winword.exe spawning powershell.exe = unusual parent→child |
| Anomaly | Learns each endpoint's baseline, flags deviations (can cause FPs) | A process modifies an auto-start registry key, rare on that host |
| IOC matching | Compares activity with threat intel feeds (doesn't work for zero-days) | Hash of a dropped executable matches a known attack tool |
| MITRE ATT&CK mapping | Labels each detection with Tactic + Technique | Scheduled task created → Tactic: Persistence, Technique: Scheduled Task/Job |
| Machine learning | Models trained on normal + malicious behavior spot whole chains | Fileless & multi-stage attacks where each step alone looks innocent |
MITRE quick key: Tactic = WHY (the attacker's goal, e.g., Persistence). Technique = HOW (the method, e.g., Scheduled Task).
3. Response
Responses can be automated (policies that block known-bad behavior) or manual (analyst decides).
The 5 manual responses:
| Response | What it does | ⚠️ Think before you click |
|---|---|---|
| Isolate host | Cuts the endpoint off the network (EDR console still connected) | Stops lateral movement; but isolating a core business server may hurt more than the attack |
| Terminate process | Kills one malicious process | Use when isolation is too costly; killing a legitimate process can break the endpoint |
| Quarantine | Moves a malicious file to a safe location where it can't run | Analyst can later restore or permanently delete |
| Remote access | Shell on the endpoint (CrowdStrike: RTR, Real Time Response) | For custom actions, scripts, deep visibility |
| Artefacts collection | Pull evidence remotely for forensics or legal action | Collect before you clean up, or evidence is gone |
Artefacts to collect:
Memory dump · Event logs · specific Folder contents · Registry hives
RTR example from the course
Linux web server hq-prd-website, analyst runs:
grep -REi 'base64_decode|eval\(|assert\(|shell_exec|system\(|passthru|exec\(|popen\(|proc_open\(' /var/www/htmlWhat it means: recursively search the website folder for PHP functions that execute code or decode hidden payloads, i.e., hunting for web shells. (Ties back to w3wp.exe → revshell.exe from the 5Ws exercise.)
AV vs EDR: The Airport ✈️
| . | AV = Immigration check 🛂 | EDR = Security officers + CCTV inside 📹 |
|---|---|---|
| Method | Matches passports against a list of known criminals (signatures) | Watches behavior everywhere inside the airport |
| Blind spot | A criminal with no record, or a pro trained to look innocent, walks right in | — |
| Watches for | Known-bad identities | Roaming near restricted areas, suspicious behavior, unattended bags |
| Can act? | Block at the gate | Act on the spot + report full details to management |
| Scope | One checkpoint | Organization-wide: a suspicious file found on one endpoint is checked across all endpoints |
The phishing macro attack, step by step
Winword.exe ──► macro runs ──► PowerShell.exe ──► 2nd-stage payload ──► injected into svchost.exe ──► remote access
   AV: "looks clean"            AV: "looks clean"
EDR: 👁️ watching every step ────────────────────────────────────────────────► 🚨 ALERT with full chain| Step | AV | EDR |
|---|---|---|
| 1. Phishing email with macro doc | Nothing (no known signature) | Logs the download, keeps watching |
| 2. User opens the doc | Nothing (winword.exe is legit) | Records winword.exe execution |
| 3. Macro spawns PowerShell | Nothing (no signature for the macro) | 🚩 Unusual parent→child: Word → PowerShell |
| 4. Obfuscated PowerShell downloads payload | Usually misses obfuscated scripts | 🚩 Flags obfuscated script execution |
| 5. Payload injected into svchost.exe | Doesn't monitor memory injection | 🚩 Detects process injection |
| 6. Remote access | No network visibility | 🚩 svchost.exe making an unexpected outbound connection |
| Final | May mark it clean | Alert with the full attack chain + response options |
Lesson: attackers live off the land: every tool used (Word, PowerShell, svchost) is legitimate. Only the sequence is malicious.
How EDR Works Under the Hood
[Agent] [Agent] [Agent] [Agent] [Agent]     ← "sensors" on every endpoint: eyes & ears
    \       \      |      /       /
     \       \     |     /       /          telemetry streamed in REAL TIME
      ▼       ▼    ▼    ▼       ▼
         ┌──────────────────────┐
         │     EDR CONSOLE      │           ← the BRAIN: correlates data, ML,
         │  👁️  🔔  📋  📊      │             matches threat intel → detections (alerts)
└──────────────────────┘- Agents (sensors): sit on each endpoint, monitor everything, do some basic signature + behavior detection locally, and send data to the console.
- Console: correlates all agent data with complex logic + ML + threat intel. "Connects the dots" into a detection = alert.
- Dashboard (CrowdStrike example): CrowdScore, new detections, SHA-based (hash) detections, prevented malware by host, most recent detections.
Telemetry = the endpoint's black box ✈️📦
Like a flight recorder: everything needed for detection and investigation.
**What's collected:
| Telemetry | Helps catch |
|---|---|
| Process executions & terminations | Suspicious parent-child relationships, malicious executables, payloads |
| Network connections | C2 communication, unusual ports, data exfiltration, lateral movement |
| Command line activity | Malicious CMD/PowerShell commands, obfuscated scripts AV often misses |
| Files & folder modifications | Data staging, ransomware encryption, malicious file drops |
| Registry modifications | Persistence and config changes (the registry is a Windows goldmine) |
Why so much data? Advanced attackers use legitimate utilities. Each action alone looks harmless; together, in the telemetry, they tell a different story. Analysts use it to find the root cause and reconstruct the timeline.
After Detection & the Bigger Ecosystem
Analyst flow: acknowledge → prioritize by severity (Critical → High → Medium → Low → Informational) → open details (files, processes, network, registry) → decide TP or FP → if TP, respond from the EDR console.
EDR is one piece of the ecosystem:
Firewall · DLP · Email Security Gateway · IAM · EDR · ...
                        │
                        ▼
SIEM ← central point of investigation for analysts- DLP = Data Loss Prevention · IAM = Identity & Access Management
Where the Course Oversimplifies ⚠️
- [Likely] The AV vs EDR comparison is partly a strawman. Modern Windows AV (e.g., Defender with AMSI) does inspect PowerShell and macros at runtime, and many "AVs" today have behavioral engines. The real difference is recording + investigation + response at scale, not "AV is blind."
- [Certain] EDR only sees devices with an agent. Unmanaged laptops, network appliances, printers, IoT, and many cloud services have no agent. Attackers love those blind spots.
- [Likely] Attackers target the EDR itself. "EDR killer" tools often load a vulnerable signed driver to disable security software from the kernel. The
sc.exe ... VBoxDrv.sysstep in the course's process tree fits that pattern. An agent that suddenly stops reporting is itself an alert. - [Likely] Isolation is a business decision. Isolating a production server can cause an outage. L1s usually recommend isolation and let L2 or the owner decide, unless the playbook says otherwise.
- [Likely] "ML detected it" is not a verdict. ML detections can be hard to explain. Your report still needs the Why, built from the process tree and telemetry, not "the EDR said so."
- [Certain] Collect evidence before cleaning. Quarantining or killing processes first can destroy what DFIR needs (memory especially).
Recap
- EDR protects endpoints anywhere, beyond the network perimeter.
- Three pillars: Visibility, Detection, Response = See it, Spot it, Stop it.
- Telemetry: (Process, Network, Command line, Files, Registry).
- Detection: (Behavioral, Anomaly, IOC, MITRE, ML). Tactic = why, Technique = how.
- Response: (Isolate, Terminate, Quarantine, Remote access, Artefacts).
- AV = passport check against a criminal list; EDR = CCTV + guards watching behavior.
- Agents (eyes) → Console (brain) → Detection (alert) → SIEM (central hub for all tools).
Logs & SIEM
One-line summary: Every device writes a diary (logs). Reading 100 diaries one by one is impossible. A SIEM gathers them all in one place, translates them into one language, connects related entries, and shouts when a rule matches.
0. The Big Picture
 Log sources (host + network)
        │  Agent/Forwarder · Syslog · Manual upload · Port forwarding
        ▼
 ┌────────────────────────────────────────────────┐
 │ SIEM: Collect → Parse → Normalize → Correlate   │
 │        → Detection rules → ALERT → Dashboard    │
 └────────────────────────────────────────────────┘
        ▼
 Analyst: investigate → TP / FP → act (tune, isolate, block, escalate)
SIEM = Security Information and Event Management.
1. Logs Everywhere: Two Kinds of Log Sources
Example network: Internet ↔ router ↔ data server, web server, 20 Linux + 50 Windows workstations. Every one of them is a log source.
| 🖥️ Host-centric | 🌐 Network-centric | |
|---|---|---|
| Captures | Events inside a host | Hosts talking to each other or the internet |
| Generated by | Windows, Linux, servers | Firewalls, IDS/IPS, routers |
| Examples | File access · authentication attempt · process execution · registry add/edit/delete · PowerShell execution | SSH connection · FTP file access · web traffic · VPN access · network file sharing |
Memory hook: Host = what happens in the room. Network = who walks through the doors.
2. Why Raw Logs Fail: "Answers Nowhere"
Each challenge maps to the SIEM feature that fixes it. Learn them as pairs:
| ❌ Problem | What it means | ✅ SIEM fix |
|---|---|---|
| Numerous log sources | Hundreds of events per second, scattered | Centralized collection |
| No centralization | SSH/RDP into each machine one by one | Centralized collection |
| Limited context | One log alone looks harmless | Correlation |
| Limited analysis | Humans can't read it all; important logs get missed | Real-time alerting (rules) + dashboards |
| Format issues | Windows ≠ Linux ≠ firewall formats | Parsing + normalization |
Limited context example: a normal-looking file access → correlated with other sources → it was a user who arrived via lateral movement after compromising another machine.
3. What a SIEM Does
The lifecycle:
- Collect data from sources
- Aggregate data
- Discover & detect threats
- Identify breaches & investigate alerts
The 5 core features:
| Feature | What it does |
|---|---|
| Centralized log collection | Pulls logs from endpoints, servers, firewalls via lightweight agents or APIs into one place |
| Normalization | Turns every format into one consistent format |
| Correlation | Finds relationships between events across sources |
| Real-time alerting | Detection rules fire → analysts notified (default rules + custom ones) |
| Dashboards & reporting | Summarized, actionable views (default + custom) |
⚠️ Parsing vs Normalization (common quiz question)
| Term | Meaning | Analogy |
|---|---|---|
| Parsing | Breaking one log into fields | Cutting a sentence into words |
| Normalization | Converting logs from all sources into one consistent format | Translating every language into English |
Correlation example: Haris (5-minute window)
| Event | Alone |
|---|---|
| VPN login from an IP never used before | Maybe travelling |
| Accesses documents on a shared drive | Normal work |
| Runs a PowerShell script | Could be admin work |
| System makes an outbound connection | Happens all the time |
Together → likely data exfiltration with compromised VPN credentials.
One dot is noise. Four connected dots are a story.
What's on a SIEM dashboard
Alert highlights · system notifications · health alerts · list of failed login attempts · events ingested count · rules triggered · top domains visited
4. Where Logs Live
Windows 🪟
- Viewed in Event Viewer (type it in the search bar).
- Every event type has a unique Event ID.
- Windows endpoint logs are forwarded to the SIEM.
Linux 🐧 (memorize these paths)
| Path | Contains |
|---|---|
/var/log/httpd | HTTP requests/responses + errors |
/var/log/cron | Cron job (scheduled task) events |
/var/log/auth.log and /var/log/secure | Authentication events |
/var/log/kern | Kernel events |
Web server 🌍
Apache logs: /var/log/apache or /var/log/httpd. Monitor requests/responses for web attacks.
5. Getting Logs Into the SIEM: Ingestion
| Method | How it works |
|---|---|
| Agent / Forwarder | Lightweight tool on the endpoint captures and sends logs (Splunk calls it a forwarder) |
| Syslog | Widely used protocol sending real-time data from web servers, databases, etc. to a central destination |
| Manual upload | Ingest offline data for quick analysis (Splunk, ELK); then normalized |
| Port-forwarding | SIEM listens on a port; endpoints send data to it |
6. Detection Rules: The Magic Behind Alerts
A detection rule is just a logical expression: IF conditions → THEN alert.
Example rules
| Condition | Alert name |
|---|---|
| 5 failed logins in 10 seconds | Multiple Failed Login Attempts (brute force) |
| Success after multiple failures | Successful Login After Multiple Login Attempts (brute force worked) 🚨 |
| User plugs in a USB | USB inserted (if USB is banned by policy) |
| Outbound traffic > 25 MB | Potential data exfiltration (threshold set by policy) |
The 2nd rule is the scary one: the 1st says "someone is knocking," the 2nd says "someone got in."
Building a rule from Windows Event IDs
Use-Case 1: attackers erase their tracks
IF   Log source = WinEventLog
AND  EventID    = 104            ← event log cleared
THEN ALERT "Event Log Cleared"
Use-Case 2: attackers ask "who am I?" after exploitation / privilege escalation
IF   Log source     = WinEventLog
AND  EventCode      = 4688       ← process created
AND  NewProcessName contains "whoami"
THEN ALERT "WHOAMI command Execution DETECTED"
Rule recipe: "Source + ID + Field = Alert"
- Log source: where is this captured?
- Event ID: which event type?
- Field value: what specific value matters (process name, user, IP)?
Why normalization matters: rules check field = value pairs. If logs aren't normalized into consistent fields, the rule has nothing to match.
🔢 Event IDs to know
| ID | Meaning | Memory hook |
|---|---|---|
| 104 | Event log cleared | "10-4, over and out: the evidence is gone" 📻 |
| 4688 | New process created | "4688 = a new process is born" |
7. Alert Investigation
Analysts live on dashboards. When an alert fires:
- Examine the events/flows behind it.
- Check which rule conditions were met.
- Decide True Positive or False Positive.
Then act
| Outcome | Action |
|---|---|
| False Positive | Tune the rule so it stops firing on this |
| True Positive | Investigate further |
| Unclear | Contact the asset owner about the activity |
| Confirmed malicious | Isolate the infected host |
| Malicious source IP | Block the IP |
8. Where the Course Oversimplifies ⚠️ (advisor notes)
- [Likely] Event ID 104 is only half the story. 104 is written to the System log when a log is cleared. Clearing the Security log produces Event ID 1102. A good "log cleared" rule watches both.
- [Certain] 4688 doesn't exist unless you turn it on. Process creation auditing must be enabled, and command-line logging is a separate setting. Many SOCs use Sysmon Event ID 1 for richer process data. A rule is useless if the log source never produces the event.
- [Likely] Name-based rules are easy to evade. "NewProcessName contains whoami" misses a renamed copy of
whoami.exe, and attackers can get the same info other ways (net user,echo %username%). It also fires when admins run it legitimately. Treat it as a signal to correlate, not a verdict. - [Likely] Thresholds like "> 25 MB" and "5 fails in 10 s" are arbitrary. Slow attacks stay under them (1 failed login per minute, small chunks of data over days). Attackers learn thresholds.
- [Certain] Linux log paths depend on the distro. Debian/Ubuntu use
/var/log/auth.logand/var/log/apache2/; RHEL/CentOS use/var/log/secureand/var/log/httpd/. If a file "doesn't exist," check the distro. - [Likely] Centralization also protects evidence. An attacker who clears logs on a host can't easily erase copies already forwarded to the SIEM. That's one of the strongest reasons to forward in real time.
- [Certain] A SIEM only sees what's onboarded. A missing log source = a blind spot with no alert. Watch the "events ingested count" and health alerts: a source going silent is itself suspicious (ties back to "silence is not safety" in internals3.md).
⚡ 30-Second Recap
- Log sources: host-centric (inside the room) vs network-centric (through the doors).
- Raw-log problems: too many, scattered, no context, too much to read, many formats.
- SIEM lifecycle; features
- Parsing = split one log into fields. Normalization = make all logs one format.
- Linux:
httpd(web),cron(scheduled),auth.log/secure(logins),kern(kernel). - Ingestion : Agent/forwarder, Syslog, Manual upload, Port-forwarding.
- Rules = Source + Event ID + Field value → Alert. 104 = log cleared, 4688 = new process.
- After an alert: FP → tune; TP → investigate, contact owner, isolate host, block IP.
Splunk Basics
One-line summary: Splunk is a SIEM built from three parts: the Forwarder ships logs, the Indexer turns them into searchable events, and the Search Head is where you ask questions in SPL.
0. The Three Components: The Library Analogy 📚
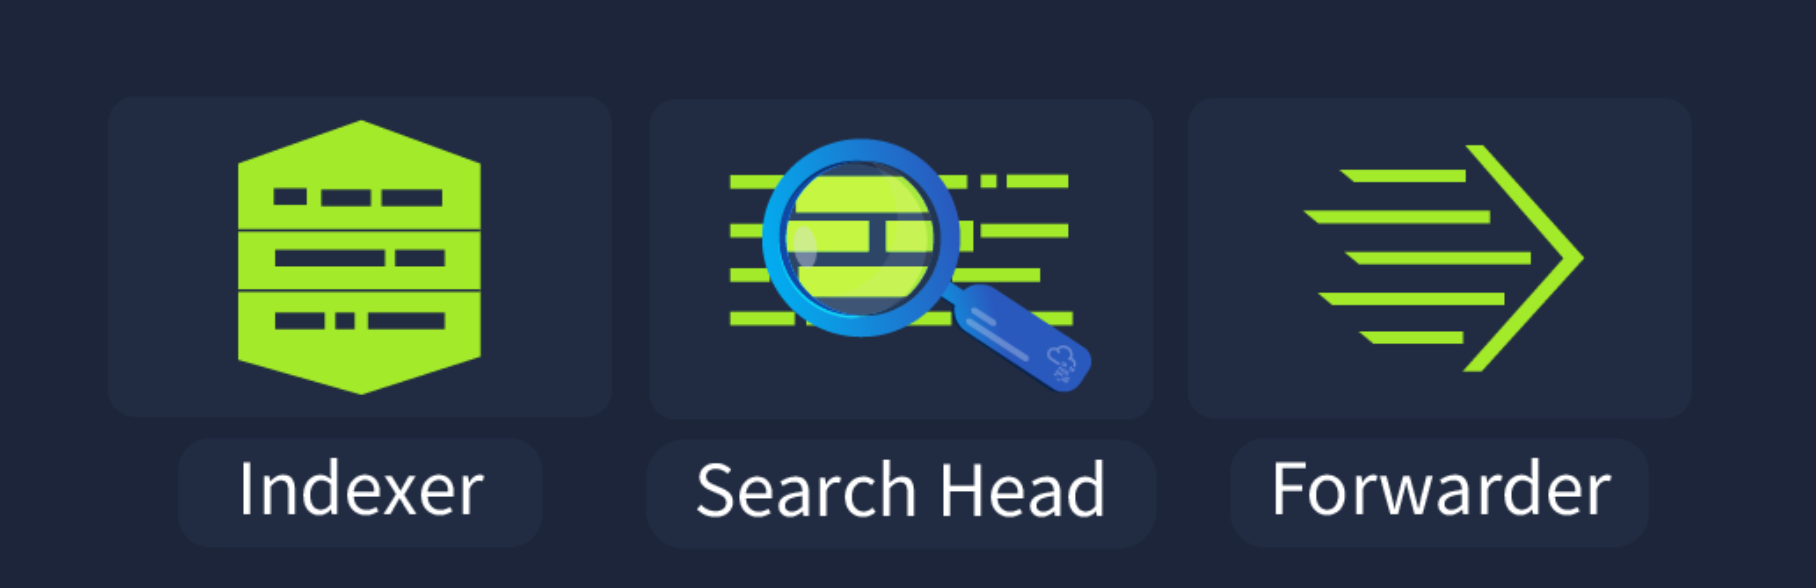
 Endpoints / servers / DBs
        │
        ▼
 ┌──────────────┐     ┌──────────────┐     ┌──────────────┐
 │  FORWARDER   │ ──► │   INDEXER    │ ◄── │ SEARCH HEAD  │ ◄── You (SPL)
 │  🚚 courier  │     │ 📚 librarian │     │ 🔍 front desk│
 └──────────────┘     └──────────────┘     └──────────────┘
   collects & sends     parses, normalizes,   sends your query to the
   logs                 categorizes, stores   indexer, shows results as
                        as EVENTS             field-value pairs
Mnemonic: → "Fetch, Index, Search" (the order data flows)
| Component | Library role | Job |
|---|---|---|
| Forwarder | 🚚 Courier | Lightweight agent on the endpoint; collects data and sends it to the Indexer; uses few resources |
| Indexer | 📚 Librarian | Parses + normalizes into field-value pairs, categorizes, stores as events → easy to search |
| Search Head | 🔍 Front desk | Inside the Search & Reporting App; you write SPL, it asks the indexer, results come back as field-value pairs |
SPL = Search Processing Language.
What the Forwarder typically collects
- Web servers → web traffic
- Windows → Event Logs, PowerShell, Sysmon
- Linux → host-centric logs
- Databases → connection requests, responses, errors
1. What Splunk Can Ingest
Splunk can ingest any data: it's transformed into a series of individual events.
Data source categories (Splunk docs)
| Category | Examples |
|---|---|
| Files & directories | Most data you'll care about lives here |
| Network events | Data from any network port, SNMP events |
| IT Operations | Nagios, NetApp, Cisco |
| Cloud services | AWS, Kinesis |
| Database services | Oracle, MySQL, MS SQL Server |
| Security services | McAfee, Active Directory, Symantec Endpoint Protection |
| Virtualization | VMware, XenApp |
| Application servers | JMX & JMS, WebLogic, WebSphere |
| Windows sources | Event Log, Registry, WMI, AD, Performance monitoring |
| Other | FIFO queues, scripted inputs (APIs), other remote interfaces |
Memory hook: if it writes data, Splunk can eat it. 🍽️
2. Adding Data: The 5-Step Upload
Click Add Data on the Splunk home screen.
| # | Step | What you choose |
|---|---|---|
| 1 | Select Source | The log file + data source |
| 2 | Source Type | Format of the logs (e.g., JSON, syslog) |
| 3 | Input Settings | The index to store them in + the HOSTNAME to tag them with |
| 4 | Review | Check all configurations |
| 5 | Done | Upload complete, ready to analyze |
Source type matters most. Pick the wrong one and Splunk won't split the data into fields properly. That's why the queries below need
spath.
3. SPL: Reading the Course Queries Line by Line
The pipe | works like an assembly line: each command takes the previous results and transforms them. Read left to right, top to bottom.
index=VPN_Logs          ← 1. FROM: which bucket of data
| spath                 ← 2. EXTRACT: pull fields out of JSON
| search Field="value"  ← 3. FILTER: keep only matching events
| stats count           ← 4. SUMMARIZE: count / group the results
**Mnemonic: "From, Extract, Filter, Summarize"
Query 1: did the import work?
index=VPN_Logs
| stats count
Counts all events in the index. Your first sanity check after any upload.
Query 2: how many events for one user?
index=VPN_Logs
| spath
| search UserName="Maleena"
| stats count
spath extracts JSON fields → keep only Maleena's events → count them.
Query 3: who used this IP?
index=VPN_Logs
| spath
| search Source_ip="107.14.182.38"
| stats values(UserName) as UserName count
values(UserName) = list of unique usernames seen from that IP. Investigation value: one IP with many different users can mean credential stuffing or a shared/compromised VPN gateway.
Query 4: logins from outside France
index=VPN_Logs
| spath
| search Source_Country!="France"
| stats count
!= means "not equal." Useful for impossible travel / unusual-location checks.
Query 5: activity from one IP
index=VPN_Logs
| spath
| search Source_ip="107.3.206.58"
| stats count
SPL cheat sheet
| Command | Does | Think of it as |
|---|---|---|
index= | Choose the data store | "Which drawer?" |
spath | Extract fields from JSON/XML | "Open the envelope" |
search | Filter after a pipe | "Keep only…" |
stats count | Count events | "How many?" |
stats values(X) | Unique values of field X | "Which ones?" |
as | Rename the output column | "Call it…" |
!= | Not equal | "Everything except…" |
4. Where the Course Oversimplifies ⚠️ (advisor notes)
- [Certain] Field names are case-sensitive, values usually aren't.
UserName≠usernameas a field name, but"maleena"matches"Maleena"as a value. A query returning 0 results usually means a field-name typo. - [Likely]
!=andNOTaren't the same.Source_Country!="France"drops events where the field is missing entirely.NOT Source_Country="France"keeps them. In investigations, "missing field" events are often the weird ones you want. - [Likely] The Indexer doesn't do all the field extraction. Splunk extracts most fields at search time ("schema on read"). That's why you sometimes need
spatheven after indexing: the data was stored, but the JSON fields weren't extracted automatically. - [Likely]
| searchafter a pipe is slower than filtering up front. In big environments, put filters in the first line (index=VPN_Logs UserName="Maleena") when the fields are already extracted. Same answer, much less work. - [Certain] There are two main forwarder types. The Universal Forwarder (lightweight, just ships data, what the course describes) and the Heavy Forwarder (can parse/filter before sending). "Doesn't affect performance" means minimal, not zero.
- [Likely] Manual upload is a lab convenience. Real SOCs ingest via forwarders/syslog continuously. Manual uploads are for offline evidence (e.g., logs handed over during an incident).
⚡ 30-Second Recap
- Forwarder (courier) → Indexer (librarian, events + field-value pairs) → Search Head (front desk, SPL).
- Splunk ingests anything and turns it into events.
- Upload: = Source, Type, Input settings (index + hostname), Review, Done.
- SPL flows through pipes: From → Extract → Filter → Summarize
- Key commands:
index=,spath,search,stats count,stats values(),!=. - Zero results? Check field-name case and whether the fields were extracted.
SOAR (Security Orchestration, Automation & Response)
One-line summary: A SOC juggles a dozen disconnected tools and drowns in alerts. SOAR plugs all the tools into one interface (Orchestration), runs the repetitive steps by itself (Automation), and takes action across tools from one place (Response), following predefined playbooks.
0. The Evolution in One Line
Logs ─► SIEM (see & alert) ─► EDR (see & act on endpoints) ─► SOAR (connect everything & act automatically)| Tool | One-word job |
|---|---|
| SIEM | Detect (collect, correlate, alert) |
| EDR | Protect the endpoint (visibility + response on hosts) |
| SOAR | Coordinate (glue all tools together + automate the work) |
1. How Traditional SOCs Work
A SOC = centralized place to monitor and protect digital assets, built on People + Process + Technology.
4 key SOC capabilities:
| Capability | What it means | Example |
|---|---|---|
| Monitoring & Detection | Continuously flag suspicious activity (mainly via SIEM) | Many failed logins on a critical workstation; login from an unknown location |
| Recovery & Remediation | SOC = first responders: isolate hosts, remove malware, stop processes (via EDR, firewall, IAM) | Isolate endpoint in EDR, block IP on firewall, disable user in IAM |
| Threat Intelligence | Constant feed of IOCs: IPs, hashes, domains | Block a malicious domain flagged by TI feeds |
| Communication | Coordinate with IT and management | Ticket for IT to verify a recently deployed patch |
2. Why Traditional SOCs Struggle
4 challenges:
| Challenge | What happens |
|---|---|
| Alert fatigue | Too many alerts, many FPs or too thin to investigate → real threats missed |
| Disconnected tools | Firewall logs handled separately from endpoint logs; tool overload |
| Manual processes | Procedures undocumented, living as "tribal knowledge" in senior heads → slow response |
| Talent shortage | Hard to hire + alert overload → burnout → slow response → attackers win time |
Picture it: one sad analyst surrounded by SIEM, EDR, Firewall, IAM, TI Feeds, and warning signs everywhere. 😩
3. What SOAR Is
SOAR unifies all security tools in one interface: no switching between SIEM, EDR, firewall, etc. It also provides ticketing and case management to document, track, and resolve incidents.
 SIEM ─────┐                        ┌──► ✅ Automated response
 TI Feeds ─┤                        │
 Firewall/ ├──►  ( SOAR )  ─────────┼──► 🔕 Reduced alert fatigue
   IDS     │                        │
 IAM ──────┘                        └──► 🔒 Consistent workflows
The 3 capabilities:
| Capability | Analogy | What it does |
|---|---|---|
| Orchestration | 🎼 Conductor | Connects tools from different vendors; defines playbooks = workflows for each alert type |
| Automation | 🤖 Autopilot | SOAR runs the playbook itself, no manual clicks |
| Response | 🖐️ Hands | Takes action across tools from one interface (block IP, disable user, open ticket) |
Key distinction: Orchestration = the plan connecting the tools. Automation = the plan running by itself.
4. Worked Example: VPN Brute Force
❌ Before SOAR: the analyst tab-switches
- SIEM: does the user normally log in from this IP?
- TI platform: what's the IP's reputation?
- IAM: disable the user if any attempt succeeded
- Ticketing system: open and track the incident
🎼 With Orchestration: a playbook
- Receive alert from SIEM
- Query SIEM: does the user normally use this IP?
- Check TI for the IP's reputation
- Query SIEM for any successful logins
- Escalate to containment
Playbooks are dynamic: each step's result decides the next. E.g., user normally uses the IP + very few failures → stop early.
🤖 With Automation: SOAR runs it alone
- SOAR receives the alert from SIEM
- Automatically queries SIEM for the user's historical logins
- Automatically checks IP reputation in TI
- If the IP is malicious → automatically disables the user in IAM
- Automatically opens a ticket with all details
🖐️ Response
From one interface: block IP on firewall + disable user in IAM + open ticket.
Before vs after SOAR: stressed analyst + scattered tools → automated response, reduced alert fatigue, faster containment.
5. Do We Still Need SOC Analysts? Yes.
| SOAR does | Analysts do |
|---|---|
| Repetitive, predictable steps | Complex investigations |
| Follows rules | Judgment calls at critical points |
| Knows the data | Knows the business context |
| Runs playbooks | Writes the playbooks |
SOAR is the autopilot; the analyst is still the pilot. ✈️
6. Playbooks in Practice
Playbook = predefined workflow for a general category of recurring alerts, built from many "if this → do that, else → do this" decisions.
🎣 Phishing playbook (alert: "Suspicious email received")
Why automate: phishing is the most common attack vector, and checking URLs/attachments against TI is slow, manual work. SOAR runs it in the background while analysts handle other cases, and can remediate confirmed phishing.
"Suspicious email received"
          │
     Create ticket
          │
  Contains URL or attachment? ──NO──► Notify the user → close
          │ YES
    ┌─────┴──────┐
   URL       Attachment
    │             │
 Check URL     Check file hash /
 reputation    sandbox the file
 (TI)          (TI)
    └─────┬──────┘
     Malicious? ──NO──► Notify user it's safe → close ticket
          │ YES
   Remediate: delete/quarantine email from mailboxes,
   block sender/URL/hash, notify users, escalate/update ticket
The course text gives the first branches (ticket → URL/attachment? → notify if none → split by URL vs attachment). [Likely] The later steps above are the standard pattern; check them against the course's flow diagram.
🩹 CVE patching playbook
Why automate: CVEs drop constantly → backlog → unpatched systems → bigger attack surface.
The flow: → "Analyse, Rate, Ticket, Test"
- Analyse the CVE details (does it affect our assets?)
- Rate the risk against a threshold (critical → urgent, low → scheduled)
- Ticket: create a patching ticket
- Test the patch before pushing to production
Testing first matters: a bad patch can take down production, causing the outage the attacker never managed.
7. Where the Course Oversimplifies ⚠️ (advisor notes)
- [Certain] The course's own automated playbook has a bug. The orchestration version checks "any successful logins?" before containment. The automated version drops that step and disables the user just because the IP is malicious. That locks out a user whose password was never cracked. Automation copies the playbook exactly, mistakes included.
- [Likely] Auto-blocking can be weaponized. If an attacker knows failed logins from a bad IP auto-disable accounts, they can lock out the CEO or the whole finance team on purpose (a denial of service using your own SOAR). High-impact actions should often need a human approval step.
- [Likely] "No more alert fatigue" is marketing. SOAR is only as good as its inputs. Feed it noisy SIEM rules and it automates noise. Garbage in, automated garbage out.
- [Likely] IP reputation is a weak signal. Shared IPs (cloud providers, VPN services, mobile carriers using CGNAT) can be "malicious" one day and your employee's hotel Wi-Fi the next.
- [Certain] Playbooks rot. APIs change, tools get replaced, attackers adapt. A playbook needs an owner and regular testing, or it silently fails.
- [Likely] CVE patching usually isn't the SOC's job alone. Typically vulnerability management / IT own patching; the SOC prioritizes and watches for exploitation. Expect shared ownership in real jobs.
⚡ 30-Second Recap
- SOC capabilities : Monitoring, Recovery, Threat intel, Communication.
- SOC challenges : Alert fatigue, Disconnected tools, Manual processes, Talent shortage.
- SOAR = : Orchestration (conductor, playbooks), Automation (autopilot), Response (hands, one interface).
- Plus ticketing & case management.
- Playbooks = if/then workflows for recurring alerts; dynamic, can stop early.
- Phishing playbook: ticket → URL/attachment? → TI check → remediate or close.
- CVE playbook : Analyse, Rate, Ticket, Test before production.
- Analysts are still needed: judgment, business context, and writing the playbooks.